Digital Marketing Metrics Explained: ROI, ROAS & More
Digital marketing metrics explained in plain English: track conversions, CPC, CPA, ROAS, ROI, and the numbers that drive growth. Learn practical steps,
What Are Digital Marketing Metrics—and Which Ones Actually Matter?
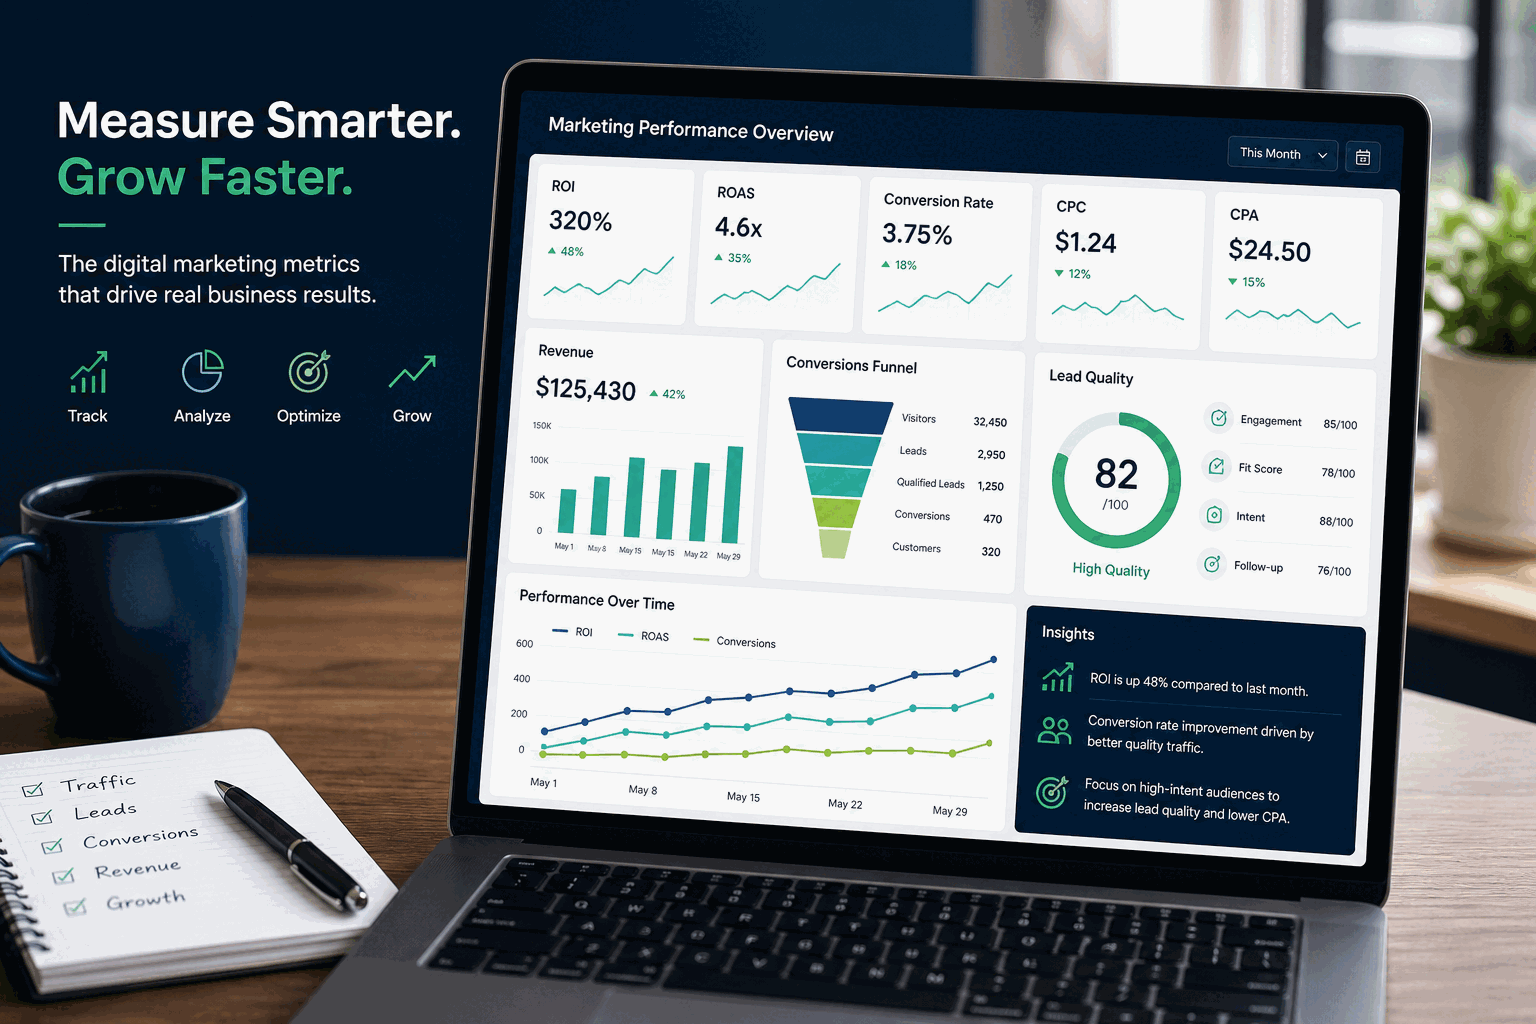
Digital marketing metrics are the measurable numbers that show what is happening across your marketing channels—paid ads, SEO, email, social media, landing pages, and your website. They help you evaluate visibility, traffic, engagement, conversions, cost efficiency, revenue, and profitability.
The most important digital marketing metrics for most businesses are:
| Metric | Formula | What It Helps You Understand |
|---|---|---|
| CTR | Clicks ÷ impressions × 100 | Whether your message is getting people to click |
| CPC | Total ad spend ÷ clicks | How much paid traffic costs |
| Conversion rate | Conversions ÷ visitors or clicks × 100 | Whether visitors are taking action |
| CPA | Total campaign cost ÷ acquisitions | How much each lead, sale, or customer costs |
| ROAS | Ad revenue ÷ ad spend | How much revenue ads generate per dollar spent |
| ROI | Net profit ÷ total investment × 100 | Whether marketing is profitable |
| Bounce rate | Non-engaged or single-page sessions ÷ total sessions × 100 | Whether visitors leave without meaningful interaction |
In plain English, digital marketing metrics answer questions like:
- Are people seeing our marketing?
- Are they clicking, visiting, or engaging?
- Are they taking the action we want?
- How much does each lead, sale, or customer cost?
- Is the campaign generating revenue or profit?
The challenge is that not all digital marketing metrics carry the same business value.
Some numbers show activity. Others show performance.
For example, impressions and clicks can tell you that your campaign is getting attention. But they do not automatically prove that marketing is helping the business grow. A campaign can generate thousands of clicks and still perform poorly if those clicks do not become leads, appointments, sales, or qualified opportunities.
That is where marketing performance metrics become more important.
Business-impact metrics include:
- Conversions
- Conversion rate
- Cost per acquisition
- Cost per qualified lead
- Revenue
- ROAS
- ROI
- Lead quality
- Customer acquisition cost
- Profit margin
These numbers connect marketing activity to real outcomes. They help you understand whether your budget is producing meaningful results, not just movement on a dashboard.
Vanity Metrics vs Business-Impact Metrics
Vanity metrics are not “bad.” They can be useful when interpreted correctly. The problem is relying on them as proof of success when they do not connect to business goals.
| Metric Type | Examples | What It Tells You | Main Limitation |
|---|---|---|---|
| Vanity or activity metrics | Impressions, views, likes, raw clicks | People are seeing or interacting with your marketing | They may not show revenue, lead quality, or profitability |
| Performance metrics | Conversions, CPA, ROAS, ROI, revenue | Marketing is producing measurable business outcomes | They require accurate tracking and context |
| Quality metrics | Qualified leads, sales calls booked, close rate | Whether marketing is attracting the right audience | Often requires CRM or sales team feedback |
A high-click campaign is only valuable if the clicks are relevant. A low-cost lead is only valuable if that lead has a realistic chance of becoming a customer. A strong ROAS may still be weak if the business has thin margins.
No metric is automatically good or bad without context.
Before judging any metric, ask:
- What was the campaign goal?
- Was the audience qualified?
- What is the average order value or customer value?
- What is the profit margin?
- Are we measuring leads, sales, or actual revenue?
Good reporting does not just show numbers. It explains what those numbers mean for the business.
Metrics vs KPIs: What Is a KPI in Digital Marketing?
A metric is any measurable data point. A KPI, or key performance indicator, is a priority metric tied to a specific business objective.
That distinction matters because marketing reports can include dozens of numbers. Not all of them deserve equal attention.
For example, clicks may be a useful metric in a paid search campaign. But if the goal is lead generation, the real KPI might be cost per qualified lead. Clicks show traffic. Cost per qualified lead shows whether the campaign is attracting prospects who may actually become customers.
A KPI should help decision-makers answer: “Are we making progress toward the result we care about most?”
Examples of Metrics vs KPIs
| Business Goal | General Metrics You Might Track | Better KPI |
|---|---|---|
| Build brand awareness | Impressions, reach, video views | Reach among the right audience |
| Increase website traffic | Clicks, sessions, CTR | Qualified sessions from target channels |
| Generate leads | Form fills, calls, landing page visits | Cost per qualified lead |
| Sell products online | Add-to-carts, purchases, revenue | ROAS, ROI, conversion rate |
| Improve website performance | Bounce rate, page speed, time on page | Conversion rate or revenue per visitor |
| Grow profitably | Revenue, spend, customer count | ROI or customer acquisition cost |
The best KPI depends on the business model.
A service business may care most about booked consultations, quote requests, or qualified phone calls. An ecommerce company may focus on revenue, ROAS, average order value, and repeat purchases. A B2B company with a longer sales cycle may track demo requests, sales-qualified leads, and pipeline value.
A useful KPI is:
- Connected to a business goal
- Measurable over time
- Clear enough for decision-making
- Relevant to the campaign’s purpose
- Reviewed consistently, not randomly
If a metric does not help you make a better decision, it may not need to be a KPI.
Digital Marketing Metrics Cheat Sheet: Formulas, Meaning & Best Use Cases
The fastest way to understand a marketing report is to know what each metric measures, how it is calculated, and what decision it helps you make.
Common Digital Marketing Metric Formulas
| Metric | What It Measures | Formula |
|---|---|---|
| Impressions | How many times your ad, page, or listing was shown | Platform-reported count |
| Clicks | How many times people clicked | Platform-reported count |
| CTR | Click-through rate | Clicks ÷ impressions × 100 |
| Cost per click | Average cost for each paid ad click | Total ad spend ÷ clicks |
| Conversions | Desired actions completed | Platform or analytics goal count |
| Conversion rate | Percentage of visitors or clicks that converted | Conversions ÷ visitors or clicks × 100 |
| Cost per acquisition | Cost to gain one customer, sale, or lead | Total campaign cost ÷ acquisitions |
| ROAS | Revenue from ads compared with ad spend | Ad revenue ÷ ad spend |
| ROI | Profit compared with total investment | Net profit ÷ total investment × 100 |
| Revenue | Sales generated | Sales value from tracked purchases or deals |
| Bounce rate | Percentage of users who leave without further interaction | Non-engaged or single-page sessions ÷ total sessions × 100 |
| Lead quality | How likely leads are to become customers | Often scored by fit, intent, budget, and sales feedback |
When to Use Each Marketing Metric
| Metric | Best Used For | Plain-English Interpretation |
|---|---|---|
| Impressions | Awareness | How often people had a chance to see your message |
| Clicks | Traffic | How many people took the first step toward your site or offer |
| CTR | Ad and listing relevance | Of the people who saw it, how many clicked |
| Cost per click | Paid traffic efficiency | What you pay to bring one visitor from an ad |
| Conversions | Lead generation, sales, bookings | How many people did what you wanted them to do |
| Conversion rate | Landing pages, ads, websites | How persuasive and effective the experience is |
| Cost per acquisition | Budget efficiency | What you spend to generate one desired result |
| ROAS | Ecommerce and revenue-focused ads | How much revenue you get back for each ad dollar |
| ROI | Profitability | Whether the full marketing investment made money |
| Revenue | Ecommerce, sales campaigns | How much money marketing helped bring in |
| Bounce rate | Website engagement and page quality | Whether visitors are leaving quickly instead of continuing |
| Lead quality | Service businesses and B2B | Whether marketing is attracting the right people |
A practical warning: formulas are only as useful as your tracking setup. If calls, forms, ecommerce purchases, CRM stages, or offline sales are not tracked correctly, your marketing performance metrics may be incomplete.
Core Digital Marketing Metrics Explained: Conversions, Conversion Rate, Bounce Rate, Cost Per Click & Cost Per Acquisition
Conversions, conversion rate, bounce rate, cost per click, and cost per acquisition are foundational digital marketing metrics most business owners see in ad, website, and lead generation reports. They help explain whether your marketing is attracting people, persuading them, keeping them engaged, and doing so at an efficient cost.
Conversions
A conversion is the desired action you want a user to take.
That action does not always have to be a purchase. Common conversions include:
- Buying a product
- Submitting a contact form
- Calling the business
- Booking an appointment
- Requesting a quote
- Signing up for an email list
- Downloading a guide
- Starting a free trial
- Scheduling a consultation
The most important question is not simply “How many conversions did we get?” It is “Are these the right conversions?”
For example, a service business may receive 100 form submissions, but if most are spam, unqualified, or outside the service area, the campaign is not performing as well as the raw number suggests.
Better conversion tracking separates:
- Total conversions
- Qualified conversions
- Sales opportunities
- Closed customers
- Revenue from those customers
Conversion Rate
Conversion rate measures the percentage of visitors or clicks that become conversions.
The formula is:
Conversion rate = conversions ÷ visitors or clicks × 100
If 1,000 people visit a landing page and 50 submit a form, the conversion rate is 5%.
Conversion rate is influenced by:
- Landing page clarity
- Offer strength
- Audience targeting
- Message match between ad and page
- Page speed
- Mobile experience
- Trust signals, testimonials, and reviews
- Form length
- Calls to action
A low conversion rate does not always mean the campaign is bad. It may mean the audience is too broad, the offer is unclear, the page is slow, or the call to action is not compelling enough.
For many small business lead generation websites, a 2% to 5% conversion rate is often used as a general directional range when evaluating performance. This is not a universal benchmark. Some landing pages convert much higher, while some ecommerce sites, higher-ticket offers, or long-sales-cycle campaigns may convert lower and still be profitable.
The better question is whether your conversion rate is improving and whether it produces qualified leads or sales at a cost your business can sustain.
Bounce Rate
Bounce rate measures the percentage of visitors who leave a page without meaningful interaction or further engagement.
Depending on the analytics platform, bounce rate may be calculated differently. In many tools, it represents single-page sessions or sessions where the visitor did not take an engaged action.
The formula is commonly expressed as:
Bounce rate = non-engaged or single-page sessions ÷ total sessions × 100
Bounce rate is useful because it can point to problems with page relevance, user experience, or intent match.
A high bounce rate may suggest:
- The page does not match what the visitor expected
- The content is unclear or not useful
- The page loads too slowly
- The mobile experience is poor
- The call to action is missing or weak
- The traffic source is sending the wrong audience
But bounce rate should not be judged by itself.
A high bounce rate on a blog post may be normal if the visitor reads the answer and leaves. A high bounce rate on a paid ad landing page may be more concerning if the goal is form submissions, phone calls, or purchases.
Use bounce rate as a diagnostic metric. It helps you investigate whether visitors are engaging, but it does not prove success or failure on its own.
Cost Per Click
Cost per click, or CPC, shows how much you pay for each ad click.
The formula is:
CPC = total ad spend ÷ clicks
If you spend $500 and receive 250 clicks, your CPC is $2.
CPC is useful because it shows the cost of bringing paid traffic to your website or landing page. It can help compare campaigns, keywords, audiences, and ad platforms.
But cheap clicks can be misleading.
A campaign with a $0.75 CPC may look efficient, but if none of those visitors convert, the traffic is not valuable. Another campaign with a $7 CPC may be more profitable if the visitors are highly qualified and become customers.
Use CPC to evaluate traffic efficiency, but do not use it alone to judge success.
Cost Per Acquisition
Cost per acquisition, or CPA, measures how much it costs to generate one desired result, such as a lead, sale, booking, or customer.
The formula is:
CPA = total campaign cost ÷ acquisitions
If you spend $2,000 and generate 40 leads, your CPA is $50 per lead.
CPA is one of the most practical metrics for small businesses because it connects spending to outcomes. It helps answer, “How much are we paying to get a result?”
However, CPA must be compared with value.
A $100 CPA may be too high if the average sale is $75. But it may be excellent if the average customer is worth $2,500 and the sales team closes a healthy percentage of leads.
ROAS vs ROI: Digital Marketing Metrics for Revenue and Profitability
ROAS and ROI are often confused, but they measure different things. ROAS focuses on revenue from ad spend. ROI focuses on profit from the total investment.
Understanding ROAS vs ROI helps you avoid mistaking revenue growth for true profitability.
What Is ROAS?
ROAS stands for return on ad spend.
The formula is:
ROAS = revenue generated from advertising ÷ ad spend
If you spend $1,000 on ads and generate $4,000 in revenue, your ROAS is 4:1, or 400%.
Common ROAS examples:
| ROAS | Meaning |
|---|---|
| 2:1 | $2 in revenue for every $1 spent on ads |
| 4:1 | $4 in revenue for every $1 spent on ads |
| 10:1 | $10 in revenue for every $1 spent on ads |
A higher ROAS is usually better, but it does not automatically mean the campaign is profitable.
Why? Because ROAS only compares ad revenue to ad spend. It does not always include:
- Product costs
- Labor
- Shipping
- Discounts
- Software
- Agency or freelancer fees
- Sales commissions
- Payment processing fees
- Fulfillment costs
- Returns or refunds
A 3:1 ROAS might be profitable for a business with strong margins. The same 3:1 ROAS might lose money for a business with high costs.
What Is ROI?
ROI stands for return on investment.
The formula is:
ROI = net profit ÷ total investment × 100
ROI gives a broader profitability view because it includes more than ad spend. It considers the total cost of the marketing effort and the profit left after expenses.
For example, if a campaign produces $10,000 in revenue but total costs are $7,000, the net profit is $3,000. If the total investment was $7,000, the ROI is about 43%.
ROAS is useful for evaluating ad efficiency. ROI is better for evaluating business profitability.
Use ROAS when you want to know:
- Which ad campaign generated more revenue
- Whether ad spend is scaling efficiently
- How paid media channels compare
Use ROI when you want to know:
- Whether the marketing investment made money
- Whether total costs are sustainable
- Whether the campaign is profitable after expenses
How to Choose the Right Marketing Performance Metrics for Better Decisions
The right marketing performance metrics depend on your funnel stage, campaign goal, business model, and decision you need to make. A good report should not overwhelm you with disconnected numbers. It should show the few metrics that explain what is working, what is not, and what to do next.
The 4 Types of Performance Metrics
A practical way to organize digital marketing metrics is by funnel stage.
| Metric Type | What It Shows | Common Metrics |
|---|---|---|
| Awareness metrics | Whether people are seeing your brand | Impressions, reach, views |
| Engagement and traffic metrics | Whether people are interacting or visiting | Clicks, CTR, CPC, sessions, bounce rate |
| Conversion metrics | Whether visitors are taking desired actions | Conversions, conversion rate, CPA |
| Revenue and profitability metrics | Whether marketing is producing financial return | Revenue, ROAS, ROI, customer value |
This structure helps prevent common reporting mistakes.
If the goal is awareness, impressions and reach matter. If the goal is lead generation, impressions are secondary to conversion rate, CPA, and lead quality. If the goal is profitable growth, ROAS and ROI become more important.
The 5 Marketing Metrics Most Businesses Should Watch
Most businesses should keep an eye on these five categories:
-
Conversion rate
Shows whether your website, landing page, or campaign is turning visitors into action-takers. -
Cost per acquisition
Shows how much you pay for each lead, sale, booking, or customer. -
ROAS or ROI
Shows whether marketing is generating revenue or profit. -
CPC, CTR, or bounce rate
Shows whether your ads, traffic sources, and landing pages are efficient and relevant. -
Revenue or lead quality
Shows whether the results are valuable, not just numerous.
The right five depend on your business.
An ecommerce brand may prioritize conversion rate, ROAS, revenue, average order value, and repeat purchase rate. A service business may prioritize qualified leads, CPA, booked calls, close rate, and ROI. A B2B company may prioritize demo requests, cost per qualified lead, pipeline value, sales cycle length, and customer acquisition cost.
A Simple Checklist for Choosing Metrics
Before reviewing your next marketing report, ask:
- What is the primary goal of this campaign?
- Are we measuring activity, outcomes, or both?
- Which metric tells us if the campaign is working?
- Which metric tells us if the campaign is profitable?
- Are leads or sales being tracked accurately?
- Do we know the difference between total conversions and qualified conversions?
- Are we comparing results to the right benchmark, time period, or channel?
The goal is not to track every possible number. The goal is to track the numbers that help you make better marketing decisions.
How Lincoln & Lincoln Digital Uses Digital Marketing Metrics to Drive Real Business Results
Digital marketing metrics are only useful when they help you make better business decisions.
A report full of clicks, impressions, rankings, bounce rates, and engagement numbers may look impressive, but those numbers do not automatically mean your marketing is working. The real question is whether your marketing is helping your business generate qualified leads, sales, booked appointments, revenue, and profit.
That is where Lincoln & Lincoln Digital focuses its approach: connecting the numbers in your reports to the outcomes your business actually needs.
Strong marketing performance usually depends on several pieces working together:
- A professional website that builds trust quickly
- Clear calls to action that tell visitors what to do next
- Accurate conversion tracking
- Campaigns aligned with your business goals
- Landing pages built for the right audience
- SEO and paid ads that attract qualified traffic
- Reporting that explains what the numbers mean in plain English
When one of those pieces is missing, your metrics can become misleading.
A paid ad campaign might have a strong cost per click, but if the landing page is confusing, conversion rate may stay low. An SEO campaign might increase traffic, but if the traffic is not from the right audience, it may not create leads. A website might look modern, but if form submissions and phone calls are not tracked properly, you may not know which marketing channels are actually producing results.
Turning Reports Into Decisions
A good marketing report should not just answer, “What happened?”
It should also answer:
- What is working?
- What is underperforming?
- Why might this be happening?
- What should we adjust next?
- Where should budget be increased, reduced, or reallocated?
- Are we generating the right kind of leads or sales?
- Is marketing helping the business grow profitably?
This is especially important for small business owners, founders, and marketing managers who do not have time to decode every platform report themselves.
Google Ads, Meta Ads, analytics dashboards, SEO tools, and CRM systems all use different terminology. Without a clear strategy, it becomes easy to mistake marketing activity for marketing progress.
Instead of stopping at “you received 2,000 clicks,” the better question is:
“What did those 2,000 clicks produce?”
That may include:
- Contact form submissions
- Phone calls
- Quote requests
- Online purchases
- Booked consultations
- Qualified leads
- Revenue from campaigns
- Cost per acquisition
- Return on ad spend
- Return on investment
The goal is not to track every possible number. The goal is to track the right numbers and use them to improve performance.
Why Your Website Affects Every Marketing Metric
Your website is one of the most important parts of your digital marketing performance.
Even if your ads are well-targeted and your SEO is bringing in traffic, your website has to convert that attention into action. If visitors do not understand what you offer, who you serve, why they should trust you, or what to do next, your conversion rate will suffer.
That affects nearly every major metric.
| If this metric looks weak | The issue may be |
|---|---|
| Low conversion rate | Landing page message, offer, trust signals, or call to action |
| High bounce rate | Page relevance, load speed, mobile experience, or content clarity |
| High cost per acquisition | Poor targeting, weak page experience, low lead quality, or inefficient bidding |
| High traffic but few leads | Wrong audience, unclear content, or missing conversion paths |
| Low ROAS | Offer, pricing, funnel, ad creative, or customer acquisition cost |
| Low ROI | Campaign costs, fulfillment costs, margins, or sales process issues |
Lincoln & Lincoln Digital looks at how your website, campaigns, and conversion paths work together. That makes it easier to identify whether the problem is traffic, messaging, targeting, tracking, user experience, or follow-up.
Better Tracking Creates Better Decisions
Accurate conversion tracking is one of the biggest differences between guessing and managing marketing with confidence.
Common tracking problems include:
- Contact forms not being counted as conversions
- Phone calls not being tracked
- Thank-you pages missing analytics tags
- Duplicate conversions inflating results
- Ecommerce revenue not being attributed correctly
- CRM leads not being connected back to campaigns
- Ads optimized for clicks instead of qualified leads
- “All leads” being treated the same, even when quality varies
The result is a blurry picture of performance.
A campaign may appear unprofitable because phone calls are not tracked. Another campaign may appear successful because it generates cheap form fills, even though the leads are low quality. SEO may be contributing to revenue, but without proper tracking, it may not get credit.
Lincoln & Lincoln Digital helps businesses create clearer measurement systems so reports reflect what actually matters.
For many businesses, the priority is simply to make sure the basics are accurate:
- Which channels bring in leads?
- Which pages convert?
- Which campaigns produce qualified inquiries?
- Which keywords or audiences drive revenue?
- How much does it cost to acquire a customer?
- Is the marketing investment profitable over time?
When the tracking is reliable, the strategy becomes easier to improve.
A Practical Example: When “More Traffic” Is Not the Answer
Imagine a service business receives 5,000 website visitors in one month but only 20 form submissions. That is a 0.4% conversion rate.
The first instinct might be to buy more ads or publish more SEO content to increase traffic. But if the website is not converting well, more traffic may simply create more missed opportunities.
In this case, Lincoln & Lincoln Digital would look at questions such as:
- Are visitors landing on the right page?
- Is the offer clear?
- Are the calls to action visible?
- Does the page explain the service in customer-friendly language?
- Are trust signals present, such as reviews, examples, or credentials?
- Is the form too long or difficult to complete?
- Is the mobile experience strong?
- Are the ads attracting the right audience?
Improving the conversion rate from 0.4% to 1% would turn the same 5,000 visitors into 50 leads instead of 20. That could create more business without increasing traffic at all.
That is the power of interpreting digital marketing metrics correctly. The answer is not always “spend more.” Sometimes the better answer is to improve the page, the message, the tracking, or the offer.
A Practical Example: When Cheap Clicks Are Not Actually Cheap
Now imagine an ecommerce business has two ad campaigns:
| Campaign | CPC | Conversion Rate | CPA | Revenue |
|---|---|---|---|---|
| Campaign A | $0.80 | 0.5% | $160 | $2,000 |
| Campaign B | $2.50 | 4% | $62.50 | $8,000 |
At first glance, Campaign A looks cheaper because the cost per click is lower. But Campaign B is much more effective because it converts at a higher rate and has a lower cost per acquisition.
This is why cost per click should not be evaluated by itself.
A higher CPC can still be profitable if the traffic is more qualified, the conversion rate is stronger, and the customer value is higher.
Ready to Make Your Marketing Metrics More Useful?
If your current reports do not clearly show which campaigns are producing qualified leads, sales, revenue, and profit, Lincoln & Lincoln Digital can help.
A practical next step is to request a marketing review or audit. The team can evaluate your website, tracking setup, campaign performance, and reporting so you can see what is working, what is underperforming, and where to focus next.
The best marketing reports do more than describe activity. They guide better decisions.
FAQ
What is KPI in digital marketing?
A KPI in digital marketing is a key performance indicator: a priority metric tied to a specific business goal.
For example, if your goal is lead generation, cost per qualified lead may be a KPI. If your goal is ecommerce sales, ROAS, ROI, revenue, or conversion rate may be KPIs.
A metric simply measures something. A KPI measures something important enough to guide decisions.
What is a good conversion rate in digital marketing?
A good conversion rate depends on your industry, offer, traffic source, and type of conversion.
For many lead generation websites, a 2% to 5% conversion rate can be a useful general directional range, but it should not be treated as a universal benchmark. Some high-performing landing pages convert much higher. Ecommerce conversion rates are often lower, especially for higher-priced products or first-time visitors.
The better question is whether your conversion rate is improving and whether it produces leads or sales at a profitable cost. A 3% conversion rate with qualified leads may be much better than a 10% conversion rate from unqualified inquiries.
Is ROAS more important than ROI?
ROAS and ROI measure different things, so one is not always more important than the other.
ROAS measures revenue generated from ad spend. It is useful for evaluating campaign efficiency, especially in paid advertising. ROI measures profitability after costs are considered. It gives a broader view of whether the marketing investment is actually profitable.
If you are managing ads day to day, ROAS is helpful. If you are evaluating business performance, ROI is usually more complete.
Is a lower cost per click always better?
No. A lower cost per click is not always better.
Cheap clicks can be low quality if they come from people who are unlikely to buy, book, call, or request a quote. A higher cost per click can be more valuable if the traffic is more qualified and converts at a stronger rate.
Instead of judging CPC alone, compare it with conversion rate, cost per acquisition, lead quality, revenue, and profitability.
What is the most important KPI for digital marketing?
The most important KPI depends on your business goal.
For an ecommerce business, revenue, ROAS, ROI, average order value, and customer acquisition cost may be most important. For a service business, qualified leads, booked calls, cost per acquisition, and close rate may matter more.
In most cases, the best KPI is the one most closely tied to revenue or profit—not just activity.
What are the 5 marketing metrics every business should watch?
Five useful marketing metrics most businesses should watch are:
- Conversion rate
- Cost per acquisition
- Return on ad spend
- Return on investment
- Revenue or qualified leads by channel
Supporting metrics like cost per click, CTR, bounce rate, impressions, search rankings, and website traffic can also be useful, but they should be interpreted in context.
What are the 4 types of marketing performance metrics?
Marketing performance metrics can often be grouped into four categories:
- Awareness metrics: impressions, reach, visibility, and brand exposure.
- Engagement metrics: clicks, time on page, bounce rate, social engagement, and email interactions.
- Conversion metrics: form submissions, purchases, calls, bookings, and conversion rate.
- Revenue and profitability metrics: ROAS, ROI, customer acquisition cost, revenue, and profit.
Together, these categories help show how people move from discovering your business to becoming customers.